Mass flux (J) is the mass of a chemical (e.g., contaminants, amendments, tracers and other chemical additives) that passes through a defined cross-sectional area over a period of time. Simply put, mass flux combines two key features of a contaminant plume: how much contaminant is in the groundwater and how fast the water is moving through a defined cross- sectional area (i.e., the contaminant concentration and the groundwater flux). Mass flux is a vector quantity, and as mentioned earlier, it is expressed as mass/time/area (e.g., g•d-1•m-2). Mass discharge (Md) is related to mass flux but is not limited to a defined area. Instead, it represents the total mass of a solute (such a contaminant) moving in the groundwater from a given source. So it is a scalar quantity, expressed as simply mass/time (e.g., g/d).
Mass flux and mass discharge estimates are valuable to understanding and managing contaminant plumes, and in fact, these concepts are the basis for existing groundwater fate and transport models and transport phenomena more generally (e.g., Bird, Stewart, and Lightfoot 2007; Hemond and Fechner-Levy 2000). However, mass flux and discharge estimates are not often used in site management decision making, partly because regulations generally focus on the concentrations of contaminants in the groundwater. Also, there has been a lack of appreciation for the value of this metric in decision making despite its use in the models used for natural attenuation evaluations and risk assessments.
This section describes the background information needed to understand mass flux and mass discharge estimates. The first section (Section 2.1) provides definitions and basic concepts. Section 2.2 provides an introduction to mathematical calculations of mass flux and mass discharge. Section 2.3 summarizes mass flux and mass discharge measurement methods. Section 2.4 briefly discusses factors that affect mass flux and discharge. Finally, Section 2.5 discusses the uncertainties and sources of error involved in developing mass flux and mass discharge estimates and methods for minimizing those uncertainties.
2.1 Basic Concepts
“Flux” is broadly defined as flow through a medium. In the physical sciences, flux is a rate measurement defined as the flow across a defined area during a defined time. The term “flux” may be applied to the flow of heat, electrons, or other substances, through a wide range of media. Measurements of flux are made across planes or surfaces that perpendicularly intersect the flow. Notably, flux estimates include both the magnitude and the direction of flow. Hence, flux is also a vector quantity (Bird, Stewart, and Lightfoot 2007).
By definition, mass flux is specific to a defined area, but when used for contaminant plumes, the area that is sampled to determine mass flux is usually small compared to the overall dimensions of the plumes. Moreover, for many purposes, the critical issue is not the mass flux across some particular area of the groundwater, but the total mass conveyed by the plume to some point along its length. Hence, a common objective is to measure the mass discharge (i.e., the “total mass flux” across an entire plume). The contaminant mass discharge can be estimated by measuring contaminant concentrations and groundwater fluxes along a transect perpendicular to groundwater flow. Figure 2-1 depicts the total groundwater discharge (Q) and total contaminant mass discharge (Md) at three transects across a plume.
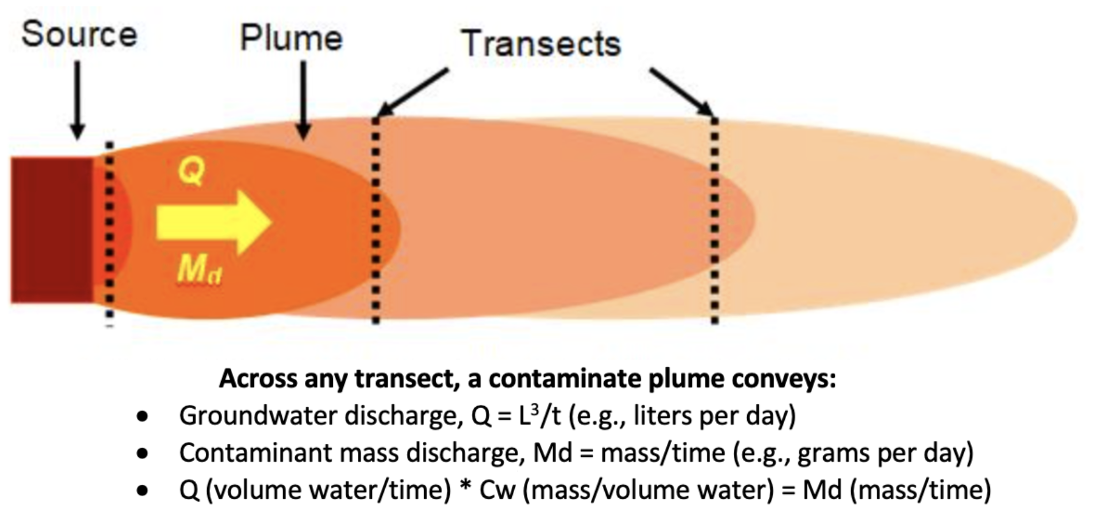
Figure 2-1. Contaminant mass discharge in plan view. Mass discharge (Md, the total contaminant mass moving through a transect per unit time) is conceptually similar to groundwater discharge (Q, the total volume of groundwater moving through a transect per unit time). Mass discharge is the product of groundwater discharge multiplied by the average contaminant concentration. (Graphic courtesy HydroGeoLogic, Inc.)
Importantly, flux is a vector, i.e., it is a point measurement with both velocity and concentration varying over all dimensions. On the other hand, discharge is an integrated variable and is a scalar quantity, as long as the location of the boundary is defined. Contaminant mass discharge is therefore the proper term to define the rate of release of contaminants from a source where the control plane is near the source and at which the attenuation properties and processes of the aquifer have had minimal impact. Contaminant mass discharge also can define the total mass crossing a “control plane” or transect at a property boundary or contaminant loading into a body of water adjacent to the plume.
In reality, the contaminant mass moving through the subsurface transect exhibits spatial variability, so several individual mass flux measurements are generally needed unless one is capturing the entire contaminant plume as a single sample. Figure 2-2 provides a conceptual depiction of Md and J values across two transects.
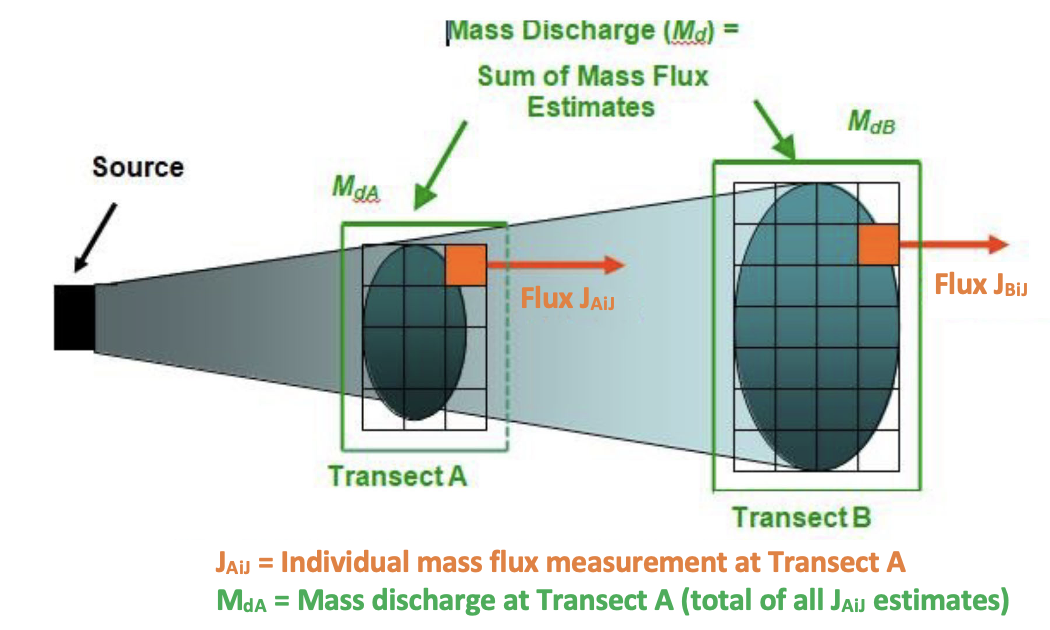
Figure 2-2. Concepts of mass flux (J) and mass discharge (Md). Flux is the mass moving past a plane of given area per unit time (e.g., g•d-1•m-2). Each square in the transect represents the mass flux for that unit area (cell i,j) of the transect. Mass discharge is the total mass flux integrated across the entire area of a transect (e.g., g•d-1•m-2). It is therefore the sum of the cells in the transect. There would be two mass discharge values for this example (MdA and MdB) at different distances downgradient from a source. These mass discharge values can be compared to evaluate conditions at the site (e.g., the natural attenuation rate). (Graphic courtesy HydroGeoLogic, Inc.)
Figures 2-3 and 2-4 depict one transect and the variations in flux resulting from variations in both concentrations and transmissivity across a plume. It is important to realize that both groundwater velocities and contaminant concentrations vary significantly across the intersecting plane in most aquifers. The typical spatial variability in both parameters makes measurement of contaminant mass flux challenging. On the other hand, it may be the case that an estimate that provides only an upper limit to the mass discharge may be less costly and just as useful. However, such upper limits can be very useful and are commonly used in risk assessment and transport modeling as a means of dealing with variability.
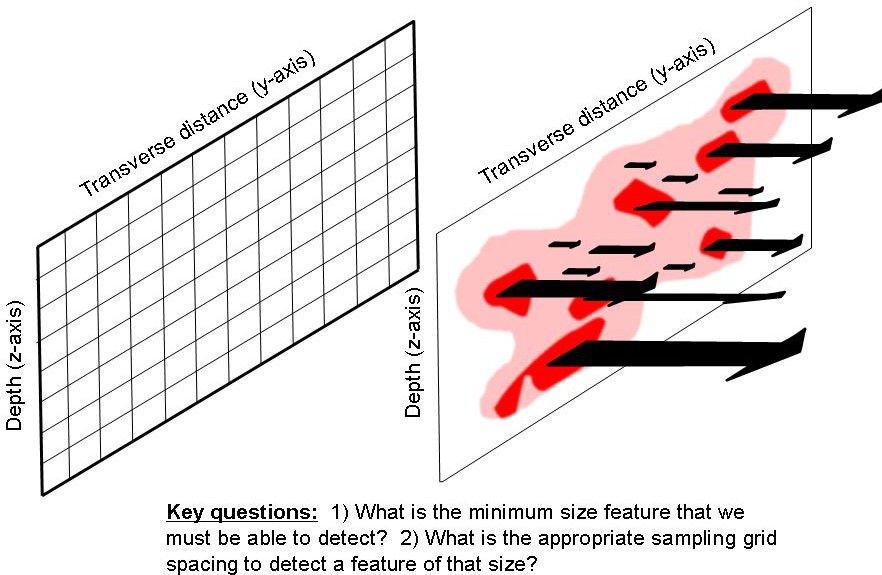
Figure 2-3. Variations in mass flux across a transect. Simultaneous measurements of groundwater flow and contaminant concentrations are made at representative grid points. Mass flux is calculated using those estimates in eq. 2-1. Summing the segments of all mass flux values across the entire plume cross section yields the contaminant mass discharge. (Graphic courtesy ARCADIS.)
2.2 Calculating Mass Flux and Mass Discharge
Mathematically, contaminant mass flux is the product of the contaminant concentration in groundwater and the groundwater flux. Thus, contaminant mass flux (J) can be calculated as follows:

where
q = groundwater flux (Darcy velocity), L3• L-2 •t (e.g., volume per area per day) (q = Q/A)
K = saturated hydraulic conductivity, L/t, (e.g., meters per day)
i = hydraulic gradient, dimensionless (e.g., meters per meter)
Cw = contaminant concentration in groundwater M/L3, (e.g., mg/liter)
Contaminant mass discharge is the integration of the contaminant mass fluxes across a selected transect:

where
A = area of the control plane, L2 (e.g., m2)
J = spatially variable contaminant flux, as defined in eq. 2.1
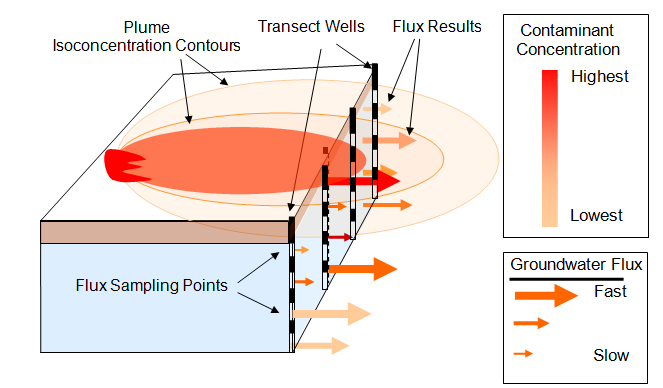
Figure 2-4. Measuring mass flux using well along a transect. Results illustrate spatial variations in mass flux across a containment plume (Graphic Courtesy HydroGeoLogic Inc.)
Other equations for calculating the mass discharge for different measurement methods are provided in Section 4.
Note that mass flux (J) varies both spatially and temporally across the control plane, and this variation may be significant. Spatial and temporal variations in mass flux are caused by variations in both contaminant concentrations and groundwater flow magnitude and direction, which typically vary widely for most dissolved plumes (Guilbeault, Parker, and Cherry 2005). In contrast, mass discharge (Md) can vary only over time at the control plane since there is only a single value for the entire control plane.
2.3 Approaches to Mass Flux Estimation
This document discusses three methods to directly measure mass flux and/or mass discharge:
- transect methods, in which concentration and flow data are measured at individual monitoring points
- well capture/pump test methods, in which groundwater is extracted and the total flow and mass discharge from the well(s) are measured (Bockelmann, Ptak, and Teutsch 2001)
- passive flux meters, in which recently developed devices are placed in wells for a period of time (Hatfield et al. 2004)
Two indirect methods to calculate mass discharge from existing data are as follows:
- calculate and multiply flow rates and contaminant concentrations along transects based on isocontours (or along transects of existing monitoring wells, if possible)
- use solute transport models that require flow and concentration data as input parameters
It is important to understand the relative strengths and limitations of direct measurements relative to the two indirect approaches (Table 2-1).
Table 2-1. Advantages and limitations of mass flux and mass discharge estimates
| Method | Advantages | Limitations |
| All mass flux methods | Improves source strength characterizationImproves potential to understand where high-contaminant-strength areas are and to focus remediation accordinglyImproves assessment of natural and enhanced attenuationDirect measurement of contaminant loading to receptorsPotential basis for relevant and measurable performance requirements | -Potential increase in characterization and/ or monitoring costs -Uncertainties related to subsurface heterogeneities -May require long times for fluxes to reach equilibrium after treatment |
| Point and transect sampling | Greater spatial information on flux and variationsLess purge water disposal neededNo change in natural flow regime | -Increased cost for sample points and analyses -Higher risk of error in mass discharge estimates due to missed high-flux zones -Need for high-resolution characterization, especially hydraulic conductivity -Greater risk of interpolation errors |
| Well capture or integral pump test | Reduced interpolation errorGreater certainty of capturing all of the mass at a given locationLow potential for missing high- flux zones | -Increased cost for wells and analyses -Increased costs for water treatment and disposal -Potential for error due to under- or over- capture of plume -Loss of spatial information -Potential capture of water that may not migrate under natural flow regimes |
Transects rely on point measurements across a plume, whether using point sampling methods or passive flux meters (PFMs). Integral pump tests (IPTs) actively extract water from one or more points. Both methods rely on data generated specifically for their determination. Transect methods (TMs) will always be limited in their ability to quantify reality because typically only a relatively small volume of the total plume is measured, though in some cases it may be necessary to take a large number of samples to reduce the overall estimate of uncertainty to acceptable levels. Mass flux estimates based on relatively few measurements of concentrations and groundwater velocity are possible and may be of value, depending on the use of the mass flux and mass discharge values. However, low-density data are less likely to detect extreme contaminant concentration and groundwater velocity values or to produce true median and mean values for either.
An IPT samples the entire plume, and spatial variability is of less concern. However, an IPT measures mass discharge under stressed conditions and requires pumping well(s) and water treatment or disposal. Unfortunately, an IPT does not provide positional information useful in placement of treatment wells or other remedial structures.
PFMs integrate contaminant concentration and groundwater flow rate over time, reducing the variability of the estimates; however, the devices may be best suited to permeable, unconsolidated formation, and multiple deployments may be needed to determine both field time and the effect of any treatment occurring during their deployment.
The two indirect, calculation-based methods (using existing data) can provide initial mass flux estimates that are useful during design of future investigations or mass flux/discharge collection plans. However, the data used are derived from information previously collected and interpreted (second-generation) processes, which may have already introduced uncertainty.
In fact, each method can be useful for different purposes, and different methods may be used at a single site at different times. For example, detailed sampling along transects may be used to characterize a site and design some remediation systems, but a relatively few PFMs may be preferable for long-term monitoring. Conversely, IPTs may provide more accurate estimates of mass discharge, since all of the contaminant mass is captured, which allows better reagent dose calculations.
More detail is provided in Section 4 for those wishing a more comprehensive review of these methods.
2.4 Factors that Affect Mass Flux
The mass flux observed at any location along a contaminant plume represents the integrated effects of transport, storage, and degradation along the flow path. Clearly mass flux estimates are impacted by the factors controlling groundwater velocity (hydraulic conductivity and gradient); thus, changes affecting these parameters (e.g., groundwater extraction rates, groundwater elevation changes, saturated thickness, recharge, plugging of pores, and seasonal variations in velocity or even flow directions) will affect mass flux. Similarly, variations in the contaminant concentrations can be affected by changes in oxidation-reduction potential due to infiltrating precipitation or seasonal water level or groundwater temperature shifts. Variations in contaminant concentration can also be caused by sorption and precipitation of inorganic contaminants.
When choosing mass flux measurement points and interpreting mass flux results, it is important to consider the effects of temporal and spatial variations. Because hydraulic conductivity, contaminant concentrations, groundwater gradients, and degradation mechanisms can vary in space, and in some cases vary in time as well, concurrent measurement of these parameters at equivalent scales is needed to reduce overall error. The following sections discuss the effects of time, the evolution and eventual structure or architecture of the dynamic plume (and spatial variability), and the heterogeneity of the subsurface that can result in enormous variations in concentrations and groundwater velocities over short distances.
2.4.1 Plume Structure and Evolution
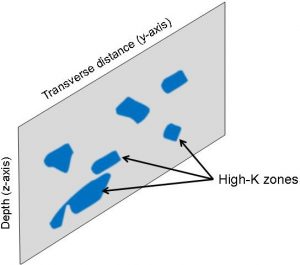
Groundwater flow tends to be concentrated in high-conductivity (high-K) zones that occupy a relatively small portion of the aquifer cross section (see Figure 2-5). Additionally, a series of mass flux measurements along a contaminant plume would show that mass flux varies considerably from the source zone to the leading edge. This information can be useful during plume characterization and selection and design of remedial actions.
For example, Figure 2-6 panel A shows a hypothetical contaminant source, with a developing plume. A series of transverse cross sections is shown. At the leading edge, contaminant arrival is observed only in the highest-velocity (high-conductivity) zones.
In transects closer to the source, where the contaminant front arrived earlier, diffusion from the more transmissive zones has caused contaminant mass accumulation in the low-permeability (low-K) zones, e.g., fine silts and clays, adjacent to the high-flow aquifer channels. This mass storage in less-transmissive zones is characteristic of near-source areas and other areas of a plume that have been in contact with contaminants for an extended time. In contrast, at the leading edge of a plume, where there has been little time for the slow diffusion of contaminant mass into less-transmissive areas, most of the mass will be in the most-transmissive zones.
Figure 2-6 panel B shows a plume soon after source removal or exhaustion—the clean water front is beginning to propagate from the upgradient end of the plume. The high-K zones are running at lower concentration than the low-K zones; the low-K zones became contaminated over time by diffusion from the previously contaminated high-K zones. The low-K zones now release residual mass from this second-generation source to recontaminate groundwater flowing primarily through the high-K zones. The clean water front propagates through the high-K zones; therefore, they are colored very lightly (slightly contaminated due to back-diffusion) in the leftmost mass flux transect in panel B. The panel is produced at a time when the treated groundwater has not yet arrived at the second mass flux transect downgradient from the former source area. The treated groundwater cannot travel faster than the groundwater flow rate through the high-K zones, and even then is impacted by continued recontamination from stored mass in the low-K zones. This effect is referred to as “back-diffusion” (Young and Ball 1998).
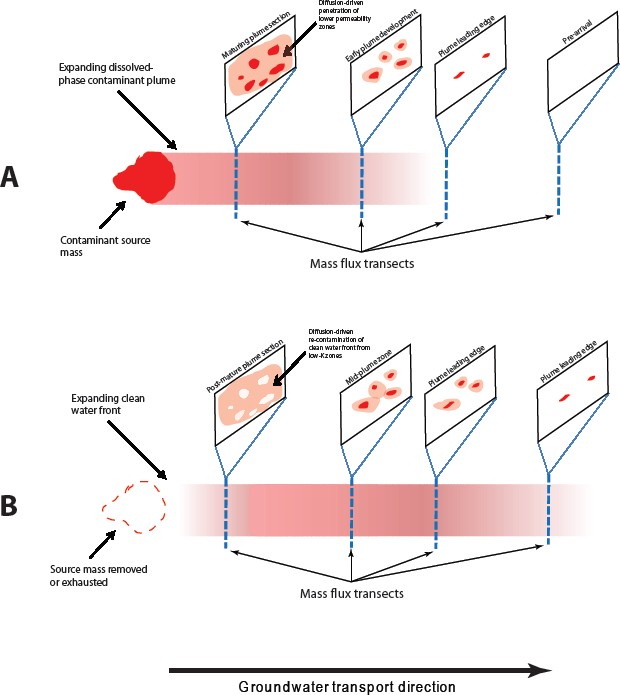
Figure 2-6. Plume structure and mass flux distribution in a hypothetical contaminant plume developing from a DNAPL source zone. A series of transects is shown, with the leading edge of contaminant arrival on the right. Note the changes in the mass storage in less transmissive zones with distance from the source. (Figure courtesy ARCADIS.)
As Figure 2-7 conceptually displays, contaminant concentrations in high-conductivity (high-K) zones in an expanding plume will often exceed those in lower-K zones, but once the plume begins to contract, the reverse will appear. High-K zones, which have had their formerly high contaminant concentration pore water forced out by lower-concentration water emanating from the depleted former source zone, will now have a lower concentration than the adjacent low-K zones.
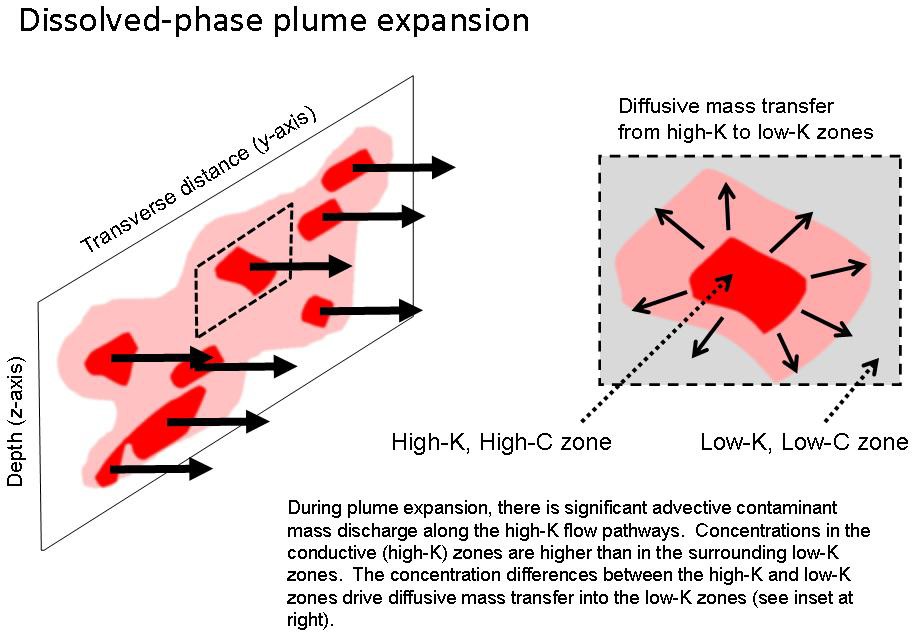
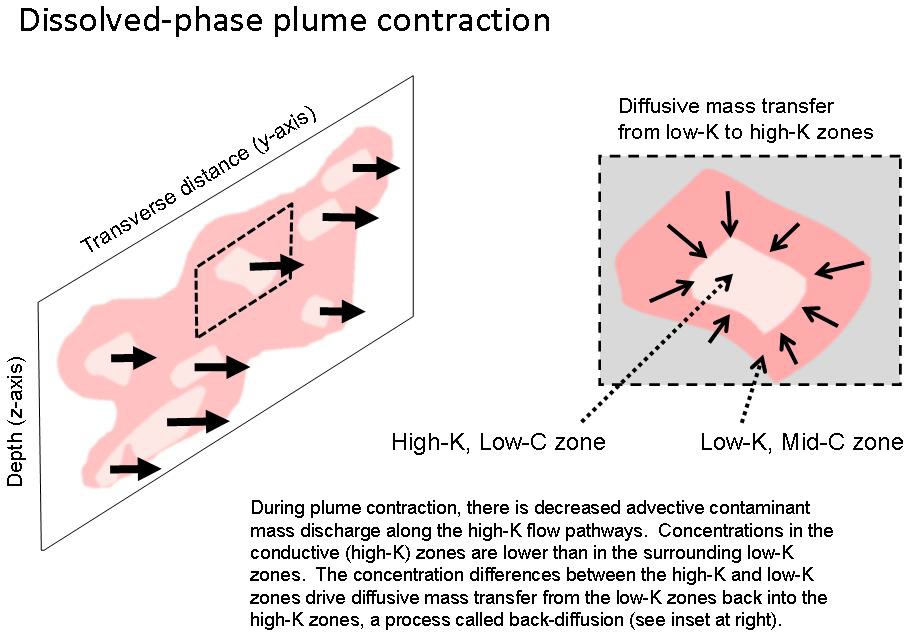
Figure 2-7. Changes in mass flux distribution over time: plume expansion and contraction through transverse cross-sectional mass flux analysis. Length of arrow is proportional to the flux. (Graphic courtesy ARCADIS.)
If the measurements were repeated periodically to form a time sequence, the mass flux would be expected to change with time; as storage sites (sorption in both high- and low-K zones and dissolved phase in low-K zones) are filled, the mass flux increases in the downgradient direction. Figure 2-8 depicts this concept and shows that there are two reasons for mass discharge to be less downgradient than through the source plane mass flux: (a) contaminant degradation and (b) mass storage on absorption sites and in low-permeability zones along the groundwater flow paths.
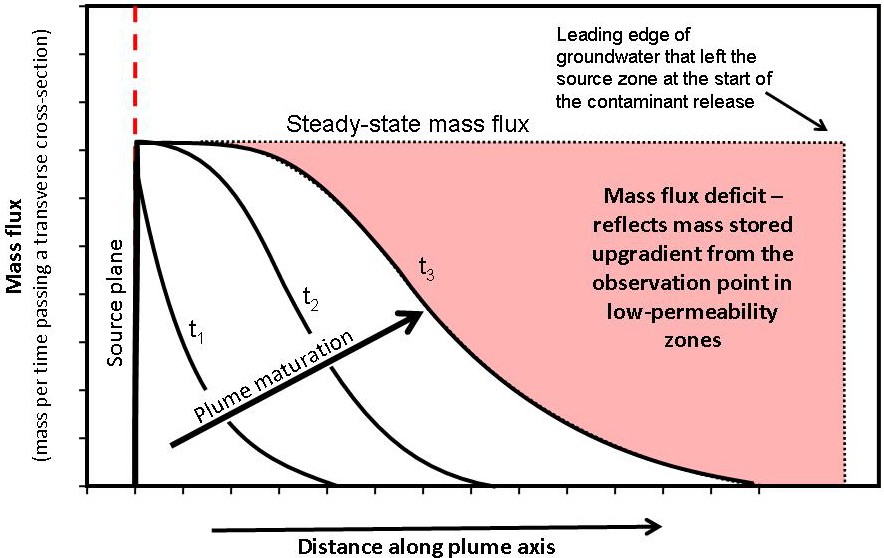
Figure 2-8. Changes in mass flux distribution in an expanding plume over time. The mass flux at any location along a plume represents the combined effects of contaminant transport, destructive attenuation (if any), and storage processes (sorption and diffusion into low-K zones). Losses of contaminant mass temporarily lower mass flux relative to the flux that is later observed at plume maturity. (Graphic courtesy ARCADIS.)
In addition, it should be recognized that variations in source strength over time are probably common with non-steady-state source terms. Increases in downgradient mass discharge could be due to an increase in the source strength, which can result from hydrogeologic changes (increased flushing or changes in groundwater flow direction or changes in groundwater levels) or continuing migration of residual nonaqueous-phase liquid (NAPL) to more or less accessible regions of the source zone. It is important to realize that the mass discharge can vary over time for many reasons and to consider all possible explanations for observed changes.
2.4.2 Subsurface Heterogeneity
A key factor affecting mass flux estimates is the high degree of heterogeneity and anisotropy in most aquifer matrices. A high degree of heterogeneity mandates a more intensive sampling effort to obtain a usable representation of mass flux for cross sections transecting the groundwater flow path. Intensive sampling may also be needed to characterize the variations in concentrations across a control plane as well. Figure 2-9 shows an exposed embankment near Healy, Alaska, illustrating the extreme variations in hydraulic conductivity that can occur in many high-energy depositional environments. Even in sand dune environments, there is a high degree of depositional structure, as shown in Figure 2-10.
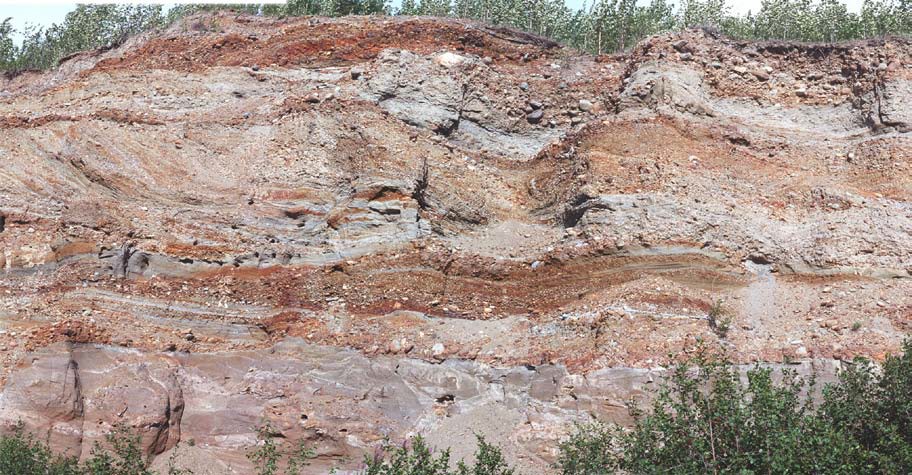
Figure 2-9. Example of a heterogeneous and anisotropic subsurface environment. In aquifer matrices developed in high-energy depositional environments (braided channels and alluvial fans, for example), the range of hydraulic conductivities over short vertical distances (and groundwater velocities) can exceed 1,000,000-fold. Exposure located near Healy, Alaska, at 63º55’47.87″N, 149º05’55.26″W. (Photo courtesy ARCADIS.)
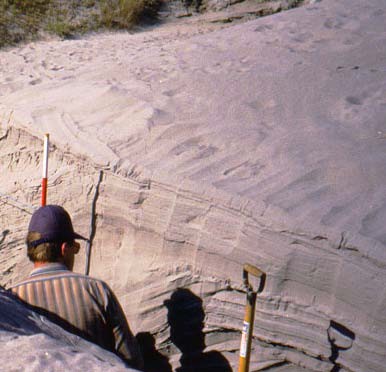
Figure 2-11 illustrates some implications of subsurface heterogeneity for the design and interpretation of mass flux analyses. Any mass flux sampling program should carefully consider the locations of monitoring points to maximize the value of the resulting data. The ability to locate monitoring points optimally for mass flux measurements requires an adequate understanding of subsurface conditions. Uncertainty in a mass discharge estimate will be reflected in the uncertainty of the CSM. That being said, considering that the state of the science uses point estimates of concentrations from monitoring wells within the current regulatory framework, the addition of mass flux, even with limited datasets, can provide more insight into the CSM and improve decision making.
As with all currently used environmental techniques, even methods of measuring mass flux that rely on capturing the entire plume (such as the IPT), will be affected by heterogeneities in the subsurface. A pump test may not capture the entire plume, or it may capture water that is outside the plume. It will definitely draw water from high-K zones more easily, increasing the measured contaminant concentration of an expanding plume and decreasing that of a contracting plume. Finally, there is always some uncertainty regarding the extrapolation of pump test results under induced flow regimes to the natural flow conditions.
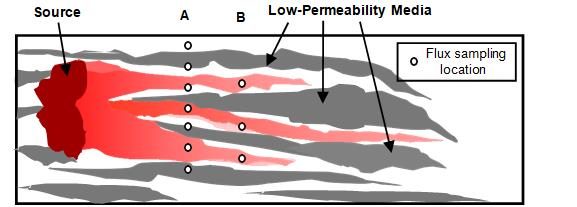
Figure 2-11. Plan view illustrating the potential impacts of geological heterogeneities on flux estimates and plume architecture. Transect A employs a regularly spaced series of monitoring points but misses much of the flux and produces a large amount of biased-low (or low-concentration) data. From information in Transect A, locate Transect B considering knowledge of the paleoenvironment and thereby using fewer monitoring points and producing a better estimate of mass discharge for lower cost.(Graphic courtesy Doug Mackay, Stanford University.)
2.5 Managing Uncertainties
Uncertainties or sources of error associated with determining mass flux are inherent to measurement-based or calculation-based methods. The effect of all sources of error is cumulative and impacts the resulting mass flux estimate.
Inherent uncertainties include spatial and temporal variability in the aquifer. Transect sampling can measure only a small fraction of the groundwater passing through a given transect. An appropriate sampling density will therefore improve the accuracy of a mass flux estimate but only to a certain limit (Kübert and Finkel 2005). Alternatively, characterizing the uncertainty may be part of the data quality objectives, thereby allowing an estimate of the upper limit on certain critical parameters. Sampling densities from points along a transect are commonly less than 1% of the total flow through the transect; thus, it is always possible to miss some fraction of the total discharge, to say the least. Even well-designed studies with high data densities have missed portions of a plume and therefore underestimated discharge (Einarson and Mackay 2001).
One implication of this assessment of uncertainty is that it will always be challenging to obtain enough samples to have high confidence in the accuracy of the mass discharge through any transect (Figure 2-12). Therefore, the accuracy needed for the purposes of any given mass flux estimate should be defined. For example, the relative comparison of the change in mass flux or discharge over time at a location, as a result of remediation, requires a different level of characterization than the measurement of mass discharge for compliance monitoring. In many cases, accuracy to within an order of magnitude may be sufficient, such as for the following:
- Evaluating the effects of remediation. Sale, Zimbron, and Dandy (2008) report that well- implemented source zone remediation projects are likely to reduce source zone groundwater concentrations by about one to possibly two orders of magnitude (90%–99% reduction) from pretreatment levels, so that a measurement resolution of one order of magnitude range would likely be able to show that there was a reduction in mass flux from a site.
- Prioritizing multiple sites. Mass discharge estimates at actual sites range over orders of magnitude (Appendix A shows a range of 0.00078–160,000 g/d). Mass flux estimates within an order of magnitude would provide useful information for prioritization across the universe of sites based on mass discharge estimates.
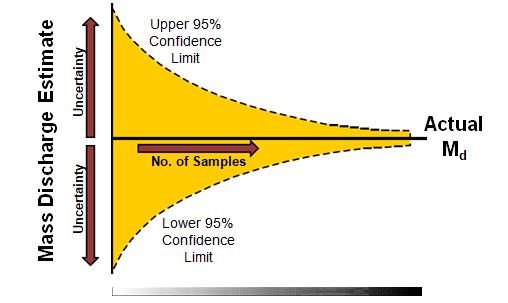
Figure 2-12. Variance of mass discharge estimates. The variance of mass discharge estimates is high because they are calculated by multiplying point estimates of two high- variance parameters (groundwater flux and contaminant concentrations), then summing the point estimates across the plane of the transect. (Graphic courtesy Porewater Solutions.)
Section 4.8 provides additional information about managing uncertainty from mass discharge/ mass flux estimates.
Sampling most real-world contaminant plumes, even at close spacing and multiple depth intervals, samples only a small fraction of the total discharge. For example, passively sampling all of the water entering a number of 2-inch wells at 5-ft spacing would allow sampling of roughly 3% of the total water crossing the transect (i.e., 2 out of every 60 inches, if there is no convergence into or divergence of flow around the sampling wells). For example, Li, Goovaerts, and Abriola (2007) estimated that 6%–7% of the groundwater should be sampled to accurately measure the effect of source zone treatments on mass discharge. They concluded that “most field applications to date may not have been based upon a sample size sufficient to accurately quantify the uncertainty of mass discharge, and the estimated mass discharge may have large errors.”
The greatest sources of error and uncertainty in mass flux or mass discharge estimates include estimates of hydraulic conductivity (K) and contaminant concentrations. For example, K values can vary dramatically over small distances, and they are difficult to measure accurately, an example of measurement-based uncertainty. As a result, K estimates are often in error by a factor of 10 or more and may represent the greatest source of error in most mass flux estimates based on sampling from a transect of wells. Inaccurate K estimates affect the accuracy of most mass flux estimates, including IPT results (see Section 4.2.6). Of course, from a practical perspective, this is an “averaging” problem that is addressed by defining a sufficiently representative environmental volume. For example, careful analyses of the relatively homogeneous Borden aquifer clearly shows that K values can vary by up to three orders of magnitude over relatively short vertical distances. However, researchers have been able to make many useful predictions and calculations about fate and transport by averaging these values appropriately.
Concentration variations can be critical as well. For example, Li (2009 personal communication) and Guilbeault, Parker, and Cherry (2005) have found that for mildly heterogeneous aquifers (in which K varies by only one order of magnitude or less), most of the uncertainty will be related to the heterogeneity of the concentration field. Guilbeault, Parker, and Cherry (2005) found that concentrations could vary by more than three orders of magnitude over vertical intervals as small as 30 cm in an aquifer with a decades-old source where the remaining dense, nonaqueous-phase liquid (DNAPL) zones were concentrated in thin horizontal layers.
Calculation-based uncertainty includes the effects of interpolation and the potential loss of information from averaging over relatively large areas from a series of multilevel sampling points, as illustrated in Figure 2-13. It is important to consider carefully the methods used to calculate the flux between points and the degree of certainty in the resulting flux and discharge estimates.
Recent publications describe processes that can reduce uncertainty in mass discharge estimates. For example, Guilbeault, Parker, and Cherry (2005) described mass flux estimates at three sites with DNAPL source zones, including a detailed discussion of the influence that vertical and horizontal sampling intervals can have on the accuracy of mass flux estimates. Figure 2-14 shows the concentration (perchloroethene [PCE]) mapping from one of those sites. The cross section spanned 26 m. Two hundred and fifty-seven samples were collected from a total of 12 boring locations and analyzed for contaminant concentrations. Fifteen mass flux hot spots were identified in the cross section. Li and Abriola (2009) developed a spatial sampling design (i.e., locations and depths) algorithm which can automatically guide concentration field characterization to focus on hot-spot areas through which most contaminant mass is transported. Tests of this algorithm using numerically generated three-dimensional plume data suggest that a sample number reduction of up to 50% can be achieved, yielding the same level of characterization accuracy.
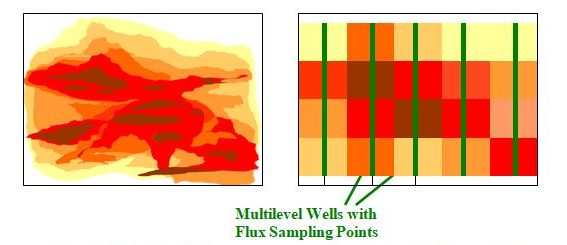
Figure 2-13. Flux interpolations from multilevel in-well sampler data. Actual flux distribution (left) and interpolated flux distribution (right) illustrate difficulties involved in estimating flux from dispersed sampling points. Notice that the potential for errors increases inversely to the scale of the heterogeneous features and directly with the distance between sampling locations. (Figure courtesy HydroGeoLogic, Inc.)
Based on the work presented by Guilbeault, Parker, and Cherry (2005), factors to consider when designing spacing intervals for a field program may include the following:
- Precharacterization can reduce sampling costs and improve accuracy. Screening technologies such as cone penetrometer testing–membrane interface probe (CPT-MIP, see Section 4.1.6) or Geoprobe® or collection of head-space analyses in vertical soil cores can focus the sampling effort on the areas with relatively high mass fluxes.
- Thin vertical sampling intervals may be needed to accurately estimate the mass discharge at sites with thin DNAPL layers. For example, 30 cm intervals were sampled by Guilbeault, Parker, and Cherry (2005) because the site had a mild degree of heterogeneity and decades- old DNAPL sources. Thicker intervals may be sufficient at sites with fresh DNAPL sources and/or less heterogeneity.
- The vertical spacing also depends on the sampling method. Closer spacing may be needed for passive monitoring wells than for sites where active pumping is used to characterize mass discharge.
- Horizontal spacing can be significantly larger than vertical spacing intervals when characterizing mass flux at sites where DNAPL is distributed predominantly in horizontal layers.
- If multiple transects are used and no intrinsic degradation is believed to be occurring, it may be possible to validate the mass flux distribution through the source plane transect by comparing this estimate to the mass discharge measured at transects farther downgradient. In this case, the use of multiple transects at a site may influence the selection of sample spacing and/or the corresponding uncertainty associated with mass flux and mass discharge estimates.
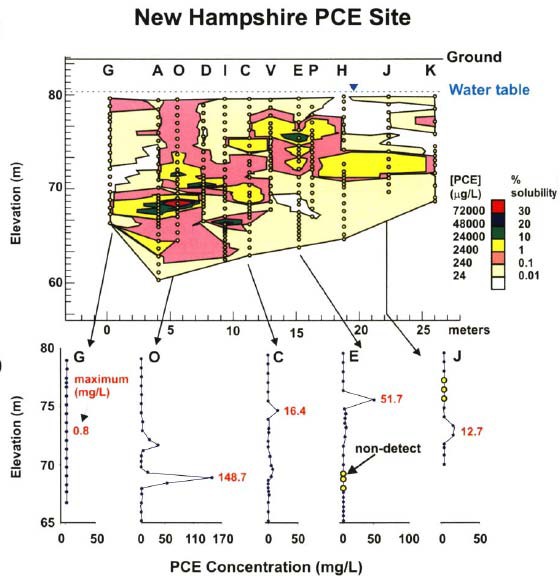
Figure 2-14. Example of a mass flux transect sampling program in a heterogeneous subsurface. Design and representative concentrations from a cross section consisting of 257 samples taken from 12 borings across a 26 m transect. Each small circle represents the location of a paired observation of groundwater flow and contaminant concentration. Results were used to calculate the mass discharge and to map the mass flux distribution.
(Reproduced from Guilbeault, Parker, and Cherry 2005.)
Click Here to download the entire document.


