OVERVIEW OF COMPARISON STUDIES WITH PASSIVE FLUX METERS
The Environmental Security Technology Certification Program conducted a study of the PFM at four sites, including the CFB Borden Site, NASA’s L-34 Site, Port Hueneme Site, and Indian Head Site. At each site, experiments were designed to provide independent estimates of both groundwater and contaminant fluxes that could be compared to fluxes measured by PFMs. The following section is based on information from ESTCP (2006a, 2006b, 2006c, 2007).
In each experiment, the PFM was constructed and installed in a monitoring well in approximately 30 minutes. The PFM consisted of carbon sorbent, packed in a sock (with tracers), and separated with impermeable dividers along the length of the sock. Each PFM was 1.5–1.6 m in length and was exposed to the groundwater for a period of 3–7.3 weeks. When the PFMs were removed, they were immediately placed in a PVC tube to prevent losses of VOCs. After removal, each 20–25 cm interval of sorbent was mixed and analyzed. The process of extraction and sampling required approximately 20 minutes per meter.
Groundwater samples were collected by pumping or bailing the monitoring well prior to sampling. Samples were collected in 40 mL volatile organic analysis (VOA) vials, placed in coolers containing dry ice, and transported to Purdue University or The University of Florida. Alcohol tracers had holding times of <14 days. The 150–160 cm PFMs were segmented into 5– 60 cm sections and transferred to containers. Samples were thoroughly mixed, placed in 250 mL wide-mouth jars, put in a cooler, and transported to Purdue University or The University of Florida. The sorbent samples had a 28-day holding time.
All samples collected were analyzed at either The University of Florida or Purdue University. Volatile organics (including tracers) were analyzed for by directed liquid injection on gas chromatographs. The detection limits were 1 mg/L. Headspace analysis (using 50 µg/L detection limits) was used if low concentrations were detected. USEPA Method 314.1 with a detection limit of 1 µg/L was used to analyze for perchlorate. Simple regression analysis was used to assess the data at individual monitoring wells. Spatial analysis was performed to assess the spatial mean and variance of contaminant/water fluxes evaluated over transects or within a plume.
CFB BORDEN SITE
The CFB Borden site was tested in three locations. The geology at the site consisted of surficial sand (approximately 3.5 m thick) overlying a clayey aquitard. The aquifer conductivities at the site ranged 0.1–15 m/d.
First Test
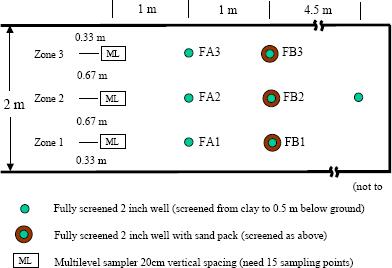
The first test used an existing sheet pile–enclosed flume for flow gate. The flume was 15 m long × 2 m wide. The test gate allowed for controlling subsurface flow, monitoring MtBE concentrations with MLSs and measuring both water and MtBE fluxes using PFMs installed in monitoring wells with different constructions. The saturated thickness of the aquifer in the gate was about 1.5 m. Steady flow was established from one pumping well located in the closed end of the flume.
Two transects were set up, consisting of three 5.1 cm, fully screened wells with installed PFMs (Figure B-1). Three monitoring wells had sand packs; the other three did not. The water flux measurements determined with the PFMs were compared with the measured flow rate of the extraction well. The PFMs also were used to measure MtBE fluxes, which were then compared to those estimated by an existing network of MLSs. The first flux measurements were made after an exposure period of one week (August 13–17, 2002) in the monitoring wells with sand packs. The second flux measurement was made after a period of one week (August 17–22, 2002) in the monitoring wells without sand packs.
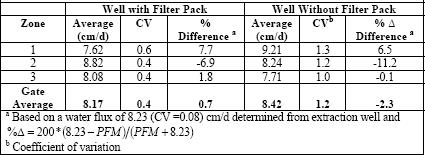
The measured groundwater flux at any monitoring well and the induced flux in the gate (8.23 ± 0.66 cm/d) varied less than 11.2% (Table B-1). The maximum coefficient of variation for measured water fluxes was 0.6 in wells constructed with a filter pack and <1.3 for simple screened wells. For screened monitoring wells, the integrated water flux obtained from averaging results of three PFMs compared to the induced flow rate was –2.3%; for wells constructed with filter packs, the integrated water flux was 0.7%. For the last field test involving the plume interception well, water fluxes were estimated within 2% of the extraction flow rate.
Table B-1. Water flux measurements by PFM to the steady induced flux in the flow gate
Total MtBE fluxes, obtained from integrating PFM measurements from the monitoring wells without sand packs, compared within 16.63% of integrated calculations from MLS. For the monitoring wells containing sand packs, total MtBE fluxes were within 1.18% of integrated calculations using depth-averaged MtBE concentrations from six flux wells and three MLS wells (Table B-2).
Table B-2. Depth-averaged MtBE concentration from MLSs and flux wells, mg/L

Second Test
The second field test took place in a controlled-release plume consisting of a mixture of 45% PCE, and 45% TCE by weight, which extended 80 m in length. For this study, 17 fully screened monitoring wells (measuring 3.2 cm) were installed 1 m downgradient of the MLS well transect No. 13. TCE and PCE data collected by the MLSs was compared to data from the PFMs. Also water flux measurements made by the PFMs were compared to those made by a BHD test (Table B-3).
Table B-3. Comparison of measured groundwater fluxes in monitoring wells located in the forested area
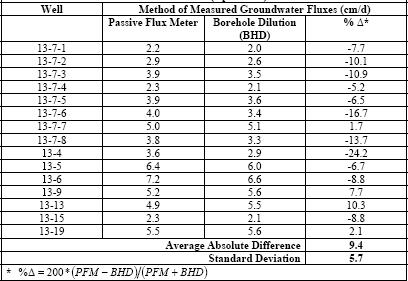
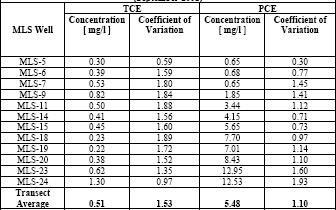
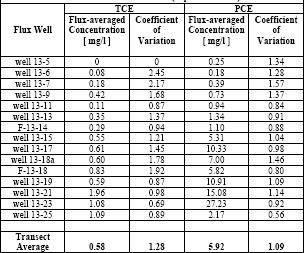
Relative concentration differences between MLS and PFM data were 3.2% for TCE and 13% for PCE when averaged over the thirteenth sampling transect (Table B-4). However, when comparing flux-averaged concentration measurements made by the MLSs and the PFM measurements at individual wells, the variation was greater than 35% (Table B-5).
Third Test
The third field test took place in the same controlled- release plume used for the second field test. For this test, a ring of eight 3.2 cm fully screened monitoring wells were placed evenly apart at a radial distance of 35 cm from an active plume interception well (Figure B-2). The purpose was to compare the measured contaminant and water fluxes obtained from the ring of PFMs to contaminant mass discharges measured at the interception well. The PFMs were spaced at 1 m intervals, and vertical resolution of sorbent sampling was 20–25 cm.
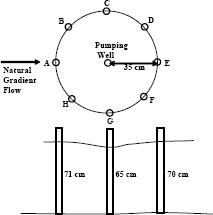
The PFM measurements of groundwater flux were compared to known fluxes and to measurements made by BHD test. Previous studies reported groundwater fluxes ranging 5–8 cm/d. The average PFM-measured flux was 6.62 cm/d with an estimated coefficient of variation of 0.33. Measured water fluxes were based on PFMs deployed for 7.3 weeks. TCE and PCE were respectively measured by PFMs to be 9%–32% of mass flow rates at the wellhead (Table B-6). A BHD was also conducted in one of the PFM wells, which showed a strong correlation between PFM-measured fluxes and BHD test results. The average absolute relative difference in measurements was 9.4%.
Table B-6. Comparison of integrated PFM measurements of water flux and PCE and TCE mass flows

NASA’s LC-34
NASA’s LC-34 site was used for testing the PFMs in a biologically simulated environment. The geology at the site is composed of surficial sand and shell deposits that extend to a depth of 45 ft, where clay is encountered. The surficial soils can be divided into three units: the Upper Sand Unit (USU), the Middle Fine-Grained Unit (MFGU), and the Lower Sand Unit (LSU). The aquifer exists within the MFGU 22–30 ft below ground surface (bgs). The sediments in the surficial aquifer are relatively permeable. The vertical hydraulic conductivity ranges from 10–3 to 10–2 cm/s. The hydraulic conductivity ranges from 1.44 × 10⁻² to 1.21 × 10⁻² cm/s in the USU, from 8.28 × 10⁻² to 5.43 × 10⁻² cm/s in the MFGU, and 1.21 × 10⁻² to 4.10 × 10⁻² cm/s in the LSU. The difference between the three upper units and the CU is 4–6 orders of magnitude (10–7 to 10–8 cm/s). Previous measurements of vertical hydraulic conductivity of the CU range from 1.5 × 10⁻⁷ to 4.5 × 10⁻⁸ cm/s with an average of 5.89 × 10⁻⁸ cm/s.
Three injection and three extraction wells were used to form a flow cell. Five MLS wells, with five sampling locations, were located within the cell (Figure B-3). The PFM flux monitoring was conducted in three wells installed upgradient of the central extraction well (EW-2). All wells were screened over the interval 16–26 ft bgs.
There were four sampling events at the site. The first provided a background measurement prior to bioremediation and was conducted after four weeks of steady water flow. TCE and degradation by-products were quantified. The second sampling event occurred during ethanol injection performed to stimulate biological activity.
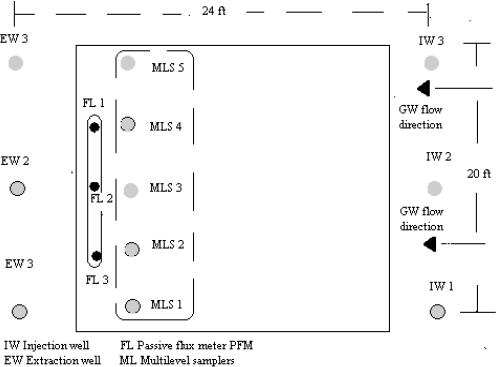
Figure B-3. Configuration of NASA LC-34 PFM test.
The third round of sampling occurred after injection of TCE-degrading microbes. The final sampling event occurred after several weeks with no additional treatment in the intervening time. The work was conducted over a one-year period.
Prior to bioaugmentation, the PFM measurements of the groundwater fluxes were within 6%– 19% of the controlled flow rate through the test cell. Following site remediation, percent differences ranged 4%–30%. Site bioactivity appeared to degrade the resident tracer ethanol. The less degradable and more highly sorbed alcohols appeared to give more reliable assessments of water flux.
Prior to remediation, integral average flux plane calculations made by PFMs and MLSs differed 0%–23%. TCE flux comparisons differences ranged 7%–113%. The average difference for local flux was 41%.
During biostimulation and after bioaugmentation, the contaminant flux estimates using PFMs and MLSs varied significantly (17%–186%). Measurements of TCE flux differences ranged 0%– 200%. The average difference for local flux was 125%. The integrated fluxes measured at the extracted well and over the PFM flux plane varied 32%–190%. The PFMs showed higher vinyl chloride and ethene fluxes than those derived from extraction well data and MLS samples, suggesting that that the PFM sorbent (activated carbon sorbent) may have trapped highly volatile compounds or that TCE and DCE degraded to vinyl chloride and ethene while sorbed on the activated carbon.
PORT HUENEME SITE
The Port Hueneme site is a shallow, unconfined, sandy aquifer contaminated with MtBE. At this site PFMs were installed in selected wells in cell cluster B, which contained wells designed with and without filter packs, installed by drilling or direct-push methods. These well clusters were located near each other, allowing groundwater flow and MtBE flux to be compared. Results were compared for both groundwater flow and MtBE flux. To evaluate the performance of wells commonly installed by drillers, wells with a 20-40 mesh sand pack surrounding 0.010-inch slotted schedule 40 PVC pipe were installed. To evaluate the performance of nonpack wells that are installed by direct-push equipment, wells were installed with a 0.010-inch slotted schedule 40 PVC pipe without filter packs. Samples were collected in vertical intervals of approximately 30 cm to determine flux distributions. Four clusters of wells were installed, consisting of the following five types of wells:
- ¾-inch-diameter pushed wells—no filter pack (#1 wells)
- ¾-inch-diameter pushed wells—ASTM specifications (#2 wells)
- ¾-inch-diameter pushed wells—“conventional” (0.010 slot, 20-40 sand)
(#3 wells) - 2-inch-diameter pushed wells—ASTM specifications (#4 wells)
- 2-inch-diameter drilled wells—ASTM specifications (#5 wells)
Groundwater fluxes estimated by aquifer conductivities and hydraulic gradients were compared to PFM measurements. The PFM measurements in ¾-inch wells compared favorably; however, the measurement in the 2-inch wells did not compare as well. (Possibly the drilling process used to install the 2-inch well loosened soil in the vicinity of the well, increasing the hydraulic conductivity.) There is a possibility that PFMs could be more sensitive to local conductivity changes than could be detected with the pneumatic slug test.
Measurements of fluxes collected with PFMs were within a factor of 2 of each other, which is likely due to the site heterogeneity. The study indicated that pushed wells measured significantly lower fluxes than 2-inch wells. Due to the site heterogeneity, flow variations between the wells were significant. As a result, the contaminant fluxes were not expected to compare between wells, regardless of well type. A comparison of flux-averaged concentrations showed no significant difference between well types.
THE INDIAN HEAD SITE
The Indian Head site was selected for testing PFMs designed with silver-impregnated granular activated carbon (SM-SI-GAC) as the sorbent, in a shallow aquifer contaminated with perchlorate. At the site, the top 2–4 ft of surficial deposits consisted of fill material, including organic material, gravel, and silty sand. The underlying 11–13 ft consisted of mottled light to olive brown clayey to sandy silts. At a depth of approximately 15 ft bgs, a 1–1.5-ft-thick layer of sand and gravel was encountered. The sand and gravel layer was underlain by a gray clay layer, which extended to a depth of at least 20 ft bgs (the maximum depth studied). Depth to groundwater ranged approximately 6.5–10.25 ft bgs. The average hydraulic gradient was 0.023 ft/ft. Slug test results indicated an average hydraulic conductivity of approximately 0.012 ft/min within the aquifer. Based on these values, the estimated groundwater flux was 0.4 ft/d.
PFMs were installed in four existing, screened, 2-inch monitoring wells. The site was divided into two zones: near source zone and plume. All monitoring wells had 10 ft screens, and two 5 ft socks were installed in each well to cover the whole screened interval. The PFMs were used twice, once for a period of three weeks and the second for a period of 6.3 weeks, and the flux measurements were compared. Before any well was used for flux measurements, it was developed and left for approximately one week to equilibrate with the flow field before a PFM was installed.
Groundwater fluxes measured with PFMs were comparable to fluxes determined by BHD tests. The groundwater flux measurements from the first sampling and second sampling events varied 21%–35%. For monitoring wells 1, 3, and 4, perchlorate fluxes respectively varied 22%, 193%, and 0% between the two sampling events. Results also indicated that the SM-SI-GAC was stable physically, chemically, and biologically for a maximum of 44 days and that the alcohol tracers and captured perchlorate on it were not biodegradable.
CAPE CANAVERAL
Figure B-4 is an example of output from the BIOCHLOR analytical model (Aziz et al. 2000) showing mass flux results at a site located on Cape Canaveral Air Station, Florida. The mass flux data, in units of mg/d, are shown at the bottom of the table located in the upper half of the output screen. The source flux is about 210,000 mg/d (about 77 kg/ year). At a point about 1085 ft downgradient, however, the modeled mass flux is only 83 mg/d (about 0.030 kg/year), or a 99.96% reduction.
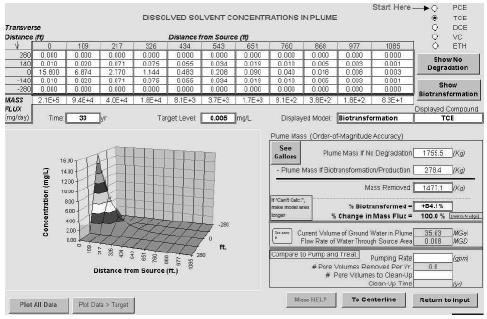
Figure B-4. BIOCHLOR output showing mass flux data.
Click Here to download the entire document.

